

In the bustling city of Spreadsheets, where data flowed like streams of numbers and formulas whispered through the air, there lived a diligent analyst named Alice. Alice had a keen eye for detail and a knack for finding patterns in the vast sea of data that surrounded her.
One day, while working on a particularly complex project, Alice stumbled upon a problem that seemed to plague her spreadsheet – duplicate values. These pesky duplicates made it challenging to spot unique data points and often led to errors in her analysis.
Determined to tackle this issue head-on, Alice turned to her trusty companion, Python. With its powerful libraries, Python was like a wizard’s wand in her hands. She quickly devised a plan to highlight cells with duplicate values in her Excel spreadsheet automatically.
Using the openpyxl library, Alice wrote a script that would iterate through each cell in her spreadsheet. For each cell, the script would check if the value had been seen before in the same column. If it had, the script would apply a vibrant color to highlight the cell, making it stand out from the rest.
With a flick of her wand – or rather, a press of the “Run” button – Alice set her script in motion. As the code executed, cells with duplicate values lit up like beacons in the darkness, guiding her towards a clearer, more accurate analysis.
Thanks to Python’s magic and Alice’s ingenuity, the city of Spreadsheets became a little brighter that day, with duplicate values no longer hiding in the shadows. And so, armed with her newfound knowledge, Alice continued her journey through the world of data, ever curious and always ready to uncover the next great insight.
Now, let us get into the coding where first we will create an Excel sheet that has duplicate values in it. You can also import or read your own Excel sheet
from openpyxl import Workbook
from random import randint

# Create a new workbook
wb = Workbook()
ws = wb.active

# Sample data with some duplicates
data = [
    ['Name', 'Age', 'City', 'Grade'],
    ['John', 25, 'New York', 'A'],
    ['Alice', 30, 'Chicago', 'B'],
    ['Bob', 25, 'New York', 'A'],
    ['Eve', 35, 'Los Angeles', 'C'],
    ['John', 25, 'New York', 'A'],
    ['Alice', 30, 'Chicago', 'B'],
    ['Bob', 25, 'New York', 'A'],
    ['Eve', 35, 'Los Angeles', 'C'],
    ['Alice', 30, 'Chicago', 'B']
]

# Populate the Excel sheet with sample data
for row_data in data:
    ws.append(row_data)

# Save the workbook
wb.save('sample_data.xlsx')
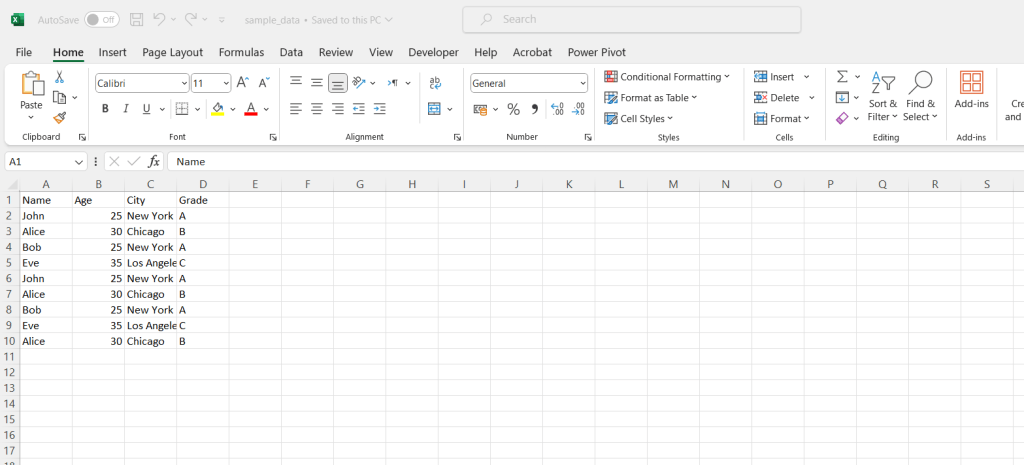
Now that we have created an Excel sheet with duplicate content. Let’s go with highlighting the duplicate cells i ll use a yellow color to highlight them.
from openpyxl import load_workbook
from openpyxl.styles import PatternFill

# Load the Excel file
wb = load_workbook('sample_data.xlsx') // replace with your file
ws = wb.active

# Track values that have been seen in each column
seen_values = {}

# Iterate over each cell and check for duplicates
for col in ws.iter_cols(min_row=1, max_row=ws.max_row, min_col=1, max_col=ws.max_column):
    for cell in col:
        if cell.value:
            # Get the column letter for the cell
            col_letter = cell.column_letter

            # Check if the value is a duplicate in the column
            if cell.value in seen_values.get(col_letter, set()):
                # Apply a fill color to highlight the cell
                cell.fill = PatternFill(start_color='FFFF00', end_color='FFFF00', fill_type='solid')
            else:
                # Add the value to the set of seen values for the column
                seen_values.setdefault(col_letter, set()).add(cell.value)

# Save the updated Excel file
wb.save('sample_data.xlsx')
Output:

Explanation of Code above:
- Import Libraries: The script starts by importing the
load_workbookfunction from theopenpyxllibrary to load the Excel file and thePatternFillclass fromopenpyxl.stylesto apply fill colors to cells. - Load Excel File: The script loads the Excel file named ‘sample_data.xlsx’ using the
load_workbookfunction and sets the active worksheet (ws) to the first sheet in the workbook. - Initialize Dictionary: A dictionary named
seen_valuesis initialized to keep track of values that have been seen in each column. The keys of the dictionary are column letters, and the values are sets of unique values seen in that column. - Iterate Through Cells: The script iterates through each column in the worksheet using the
iter_colsmethod. For each cell in the column, it checks if the cell has a value (cell.value). - Check for Duplicates: If the cell has a value, the script gets the column letter (
col_letter) of the cell and checks if the value is already in the set of seen values for that column (seen_values.get(col_letter, set())). If the value is in the set, it means it’s a duplicate, and the script applies a yellow fill color to highlight the cell usingPatternFill. - Update Seen Values: If the value is not in the set of seen values, it adds the value to the set for that column using
seen_values.setdefault(col_letter, set()).add(cell.value). - Save the Updated File: Finally, the script saves the updated Excel file with the highlighted cells using
wb.save('sample_data.xlsx').
This script efficiently highlights duplicate values in each column of the Excel spreadsheet, helping to identify and manage duplicate data.
n conclusion, using Python to automatically highlight cells in Excel with duplicate values is a powerful and efficient way to manage and identify duplicate data in your spreadsheets. By leveraging the openpyxl library, you can easily load Excel files, iterate through cells, and apply formatting to highlight duplicates. This approach not only saves time but also improves data accuracy by making it easier to spot and address duplicate entries. Whether you’re working with small datasets or large spreadsheets, automating this process with Python can streamline your workflow and enhance your data management capabilities in Excel.





Leave a Reply